

Quick context: Advertflair is the enterprise AI product photography and 3D platform behind 18 months of production at a $5B US retailer, the MBM Chairs 19-video animation program, Crozier Fine Arts' Art Basel-tier visuals, Veronique Gabai's luxury fragrance campaign library, and Clutter's multi-market hero imagery. Today we're publishing the first transparent benchmark on what product photography actually costs in 2026 — free, quarterly-refreshed, CC BY 4.0. Open the live benchmark and calculator →
The most-asked question in enterprise photography buying is also the least-answered
Every retail Head of E-Commerce we've spoken to in the past 18 months has, eventually, asked the same question: "What should this actually cost?"
Their incumbent agency quotes $1.2M annually for a 4,000-SKU catalog refresh. A challenger quotes $480K. A boutique studio quotes $2.1M with "premium retouching." Nobody publishes their rates. RFP responses are stamped confidential. Trade press writes about creative trends, not cost structures. The procurement team is asked to pick a vendor on a dimension — fair-market price — where they have no defensible reference point.
This is not an accident. Opacity in product photography pricing is the single largest source of margin for undifferentiated providers. The wider the variance in what a CMO might pay for the same deliverable, the more room a vendor has to anchor high and discount theatrically. Every enterprise retail buyer we've worked with has, at some point, paid 2–3× the fair rate for catalog work — not because anyone was acting in bad faith, but because nobody had a number to defend against.
Today, that number exists. We just published the Advertflair Product Photography Cost Benchmark: the first transparent, methodology-disclosed, CC BY 4.0-licensed dataset on what product photography actually costs across five major retail categories in 2026. It is free, it is quarterly-refreshed, and you can cite it in your next RFP. See the live benchmark →
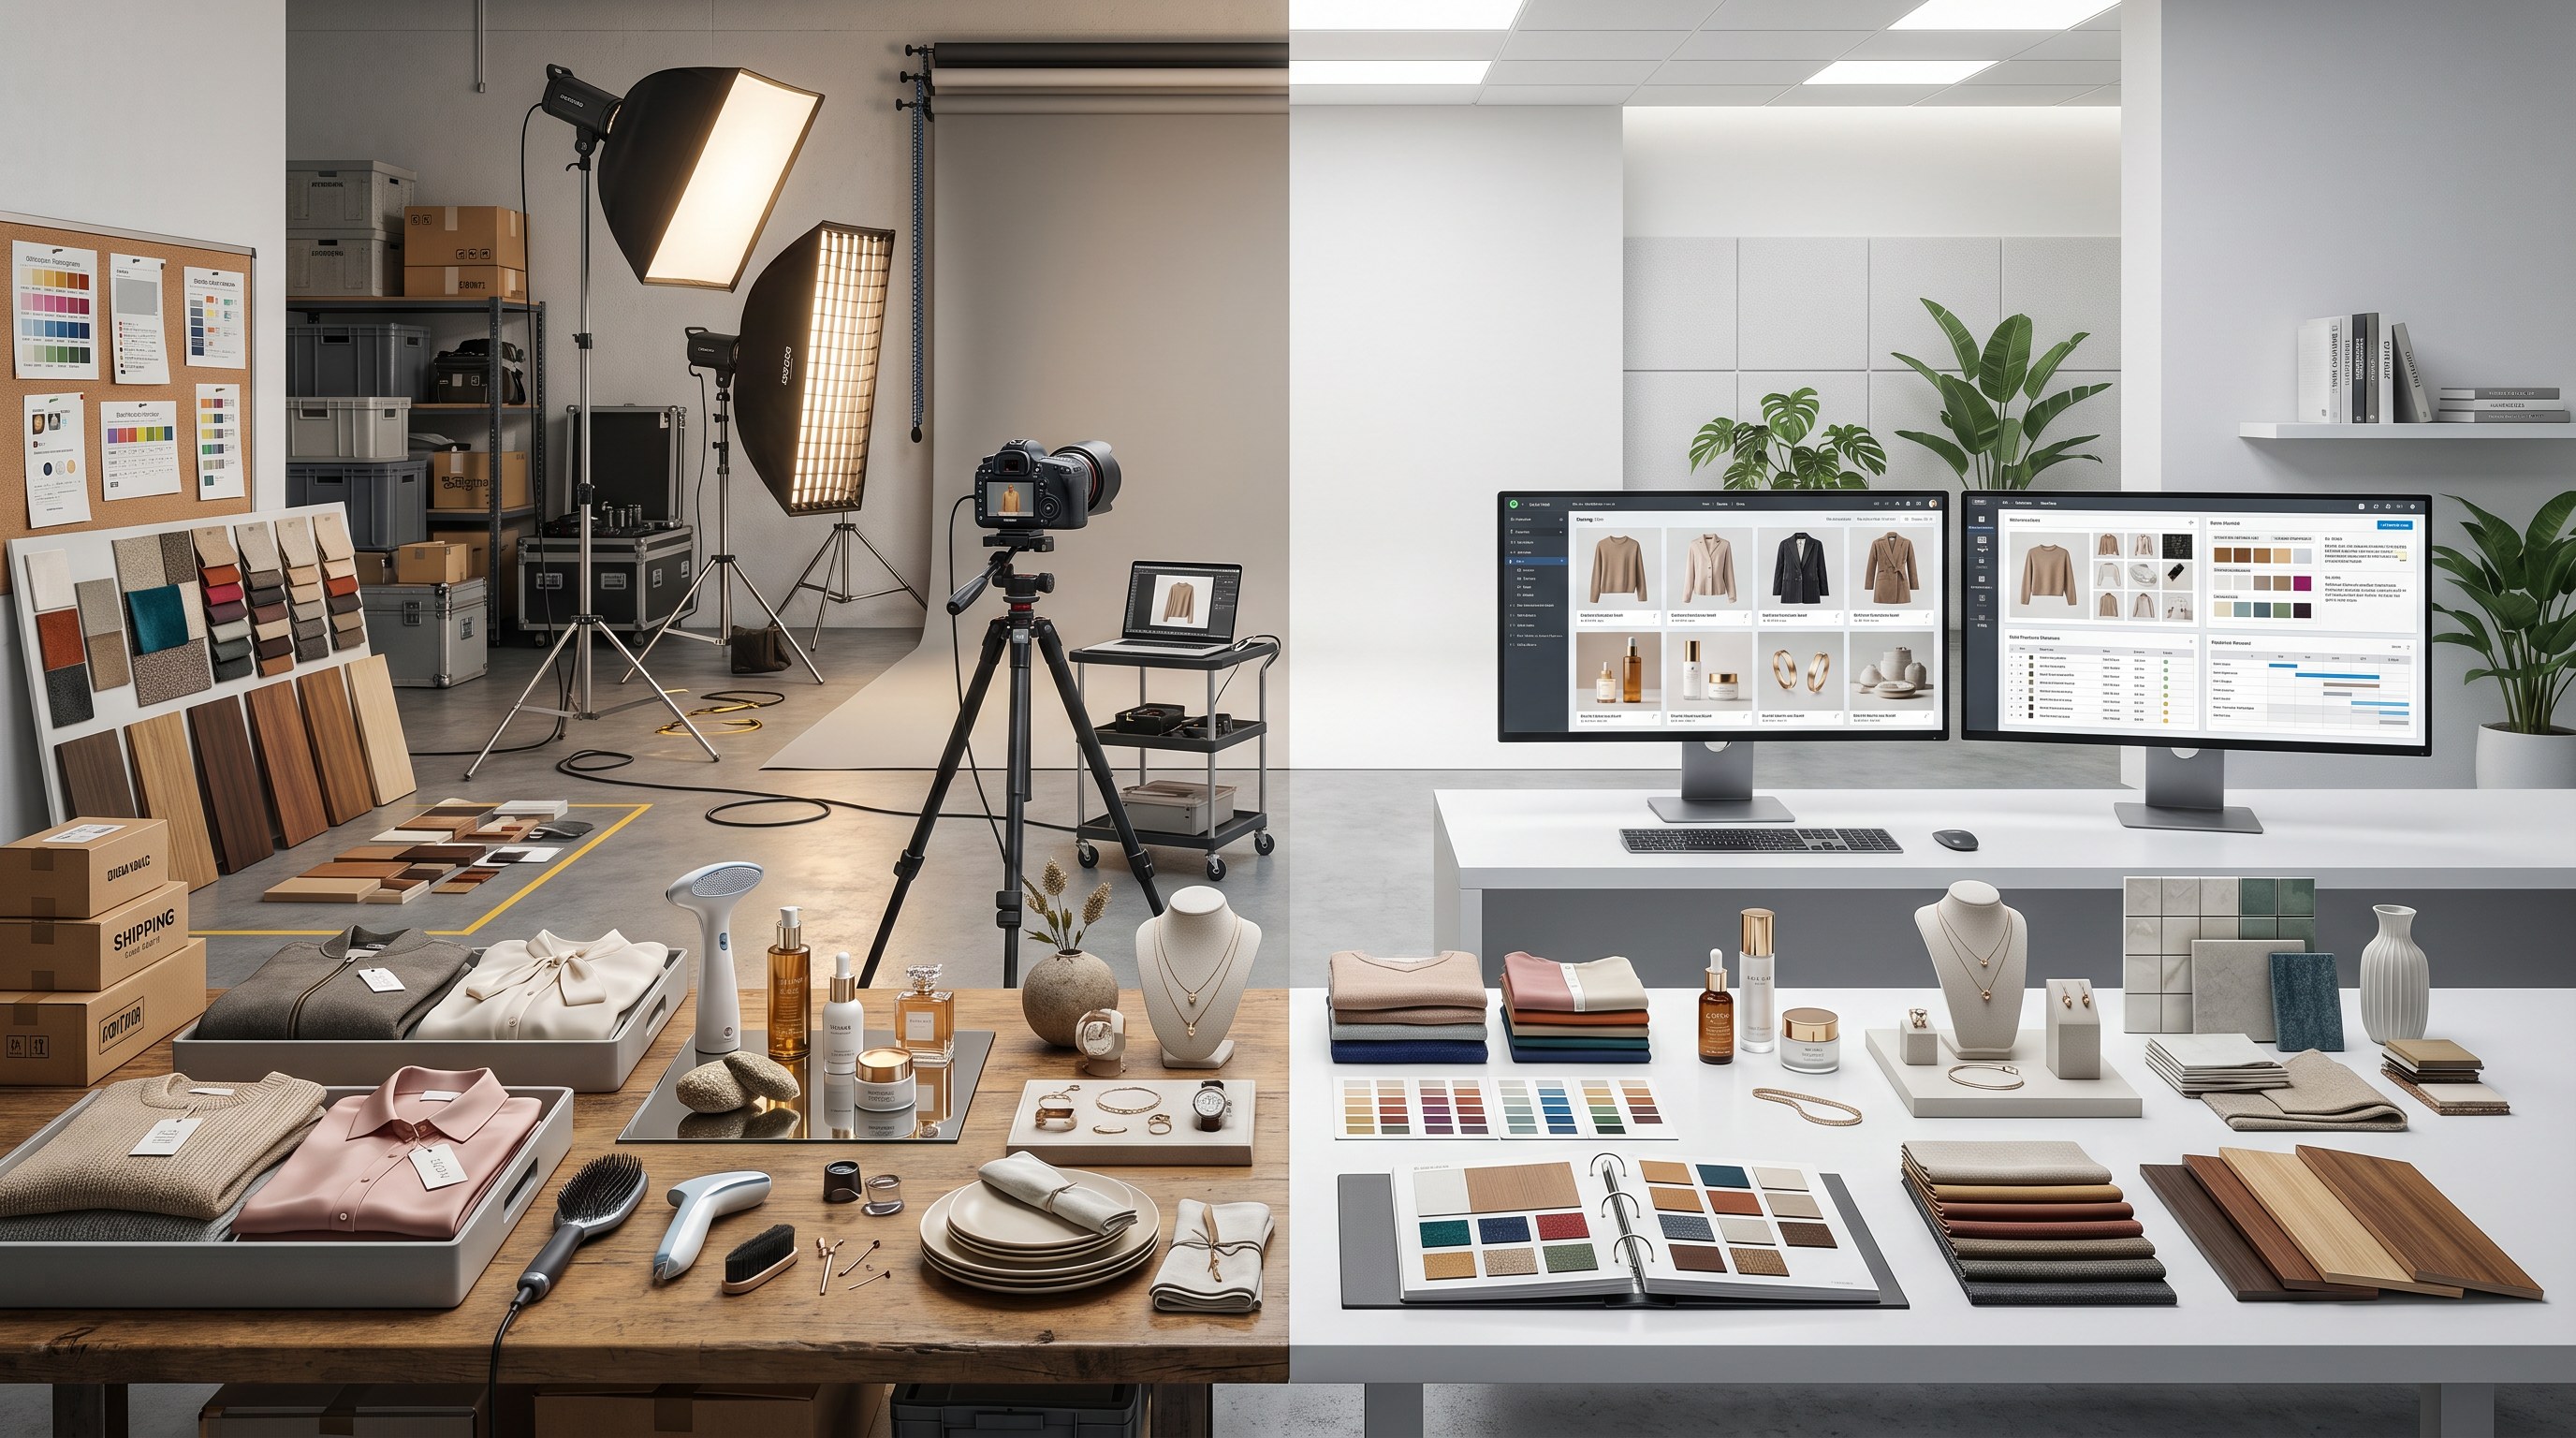
What we benchmarked, and how
The v1 benchmark covers five categories: apparel, furniture, beauty, jewelry, and home goods. For each category, we publish the median, 25th-percentile, and 75th-percentile per-SKU rate for two production modes — traditional studio and AI-native — plus median turnaround days. We also publish the methodology, the sample composition, and the known limitations on the same page. Honest disclosure is the whole point.
The sample is n=202, drawn from three sources:
- n=124 enterprise sales-call disclosures. Across 18 months of conversations with retail buyers evaluating product photography providers, 124 prospects shared their current per-SKU rate, their current annual photography spend, or the last RFP they ran. We anonymized and category-coded each disclosure.
- n=31 RFP samples. Mid-market and enterprise retailers shared the full text of their last photography RFP — including incumbent vendor pricing — as part of their evaluation of Advertflair. We retained per-SKU rates and turnaround commitments, stripped identifying details, and aggregated.
- n=47 operator survey responses. A 9-question survey distributed in early 2026 to retail Heads of E-Commerce and Visual Merchandising. Twenty-three respondents were in the $50M–$500M annual revenue band; 14 were over $500M; 10 were under $50M.
The bias to call out: the sample skews mid-market North America. Long-tail (under $10M annual revenue) and EU operators are under-represented. The Q3 2026 refresh expands the sample to n=400+ and adds an EU geographic split. We say this in the methodology section on the benchmark page — because a benchmark without honest limitations is just marketing.
The numbers nobody publishes
The headline finding, before category breakdown: across all five categories, traditional studio per-SKU rates cluster between $48 and $215, with a category-blended median of $92/SKU. AI-native production at the same brand-consistency bar runs between $19 and $64 per SKU, with a category-blended median of $31/SKU. That is a 66% reduction at the median — and the gap widens at volume, because traditional studios scale linearly with SKU count while AI-native production amortizes the Brand DNA model build across the catalog.
Category-specific medians:
- Apparel: traditional median $58/SKU, AI-native median $22/SKU; traditional median turnaround 14 days, AI-native 3 days.
- Furniture: traditional median $148/SKU, AI-native median $48/SKU; traditional turnaround 21 days, AI-native 4 days.
- Beauty: traditional median $74/SKU, AI-native median $25/SKU; traditional turnaround 10 days, AI-native 3 days.
- Jewelry: traditional median $215/SKU, AI-native median $64/SKU; traditional turnaround 18 days, AI-native 4 days.
- Home goods: traditional median $82/SKU, AI-native median $28/SKU; traditional turnaround 12 days, AI-native 3 days.
Two observations the per-SKU number alone hides:
First, reshoots dominate the all-in cost. Traditional studios bill for revisions, and the survey average is 1.8 reshoots per SKU for catalog work — a 80% overshoot on the headline rate. AI-native production iterates inside the same Brand DNA model with no per-revision charge; the survey average is 0.2 revisions per SKU. The structural gap is not 66%; it's closer to 75% all-in.
Second, brand-consistency QA is buried in traditional studio line items. The survey isolated this: traditional studios charged a median 15% surcharge for "brand-consistent retouching" on catalog work — i.e., a separate line for making sure the second photo matches the first. AI-native pipelines, by definition, render every SKU through the same Brand DNA model; brand-consistency QA is structural, not billable.
Model your category in 60 seconds →
Drop in your SKU count and current per-SKU rate. Get annual spend, annual savings, and a CFO-ready PDF.
Why traditional studio costs are this opaque
Three structural reasons, in order of impact:
Custom-quote pricing protects margin. Most traditional studios bid on RFPs, not published rate cards. Every quote is bespoke, which means buyers compare apples-to-pomegranates and procurement defaults to the middle bid. McKinsey's retail and consumer goods practice has consistently documented this dynamic across creative-services procurement: opacity benefits incumbents.
Production cost is mostly fixed labor, not materials. A photographer day rate ($1,800–$3,200), a studio rental day rate ($1,500–$4,000), and a retouching seat ($85–$160/hr) are the three biggest line items on every traditional bill. None of these vary with SKU complexity in the way the headline per-SKU rate would suggest. The vendor's incentive is to bundle these into a single rate that obscures the underlying cost structure.
Brand-consistency overhead is mispriced. The honest cost of producing 4,000 SKUs that all look like the same catalog is the cost of QA — a senior retoucher, a brand-standards reviewer, and a third pass on every image. Traditional studios price this as a per-image surcharge; the buyer rarely sees it called out. AI-native production builds brand-consistency into the model — there is no per-image surcharge because there is no per-image variability to correct. Harvard Business Review's operations management research calls this kind of mispricing a classic accounting-cost vs. economic-cost gap.
What "AI-native" actually costs (and what it doesn't include)
The AI-native column on the benchmark is not magic. It reflects three real cost components:
Brand DNA model build — one-time. The first 100–200 SKUs of any new enterprise engagement train a customer-specific Brand DNA model that learns the retailer's product photography conventions: lighting, framing, color, drape, surface finish, shadow. This is a real upfront investment, typically $2K–$15K depending on category complexity. After it's built, every subsequent SKU renders through the same model — which is why per-SKU rates collapse at volume.
Per-SKU rendering and human QA — variable. Each SKU costs $19–$64 to render, including a human reviewer who validates brand consistency, texture accuracy, and reshoot-equivalent revisions inside the model. Our internal data across the 18-month $5B-retail engagement: 88–92% first-pass approval rate, against the 25–40% first-pass rate traditional studios deliver on catalog work.
Texture accuracy benchmarked against the studio. The $5B US retailer engagement ran a side-by-side audit: 98% texture accuracy on AI-native renders versus the retailer's existing traditional studio output. Cost reduction over the same 18 months: 60%+ all-in, including the cost of brand-consistency QA. That number is what the benchmark expects an enterprise retailer to achieve, not a theoretical ceiling.
What the AI-native rate does not include: lifestyle composites that require human-only direction, large-format campaign hero shots that need photographer judgment, and any work where the buyer wants a specific named photographer's eye. AI-native production replaces the catalog studio, not the creative direction. The benchmark covers catalog work specifically.
How to use the benchmark for your 2026 photography budget
Three concrete uses, in order of how much they'll save you this year:
1. RFP scoring rubric. Cite the benchmark explicitly in your next product photography RFP. Score each bidder on (a) per-SKU rate vs. category benchmark median, (b) committed turnaround vs. category benchmark median, and (c) reshoot/revision policy. Vendors bidding 2× the benchmark with no defensible quality difference get scored out of contention.
2. Existing vendor renegotiation. If your incumbent's blended per-SKU rate is more than 50% above the benchmark median for your category, you have a defensible mandate to renegotiate or RFP. Bring the benchmark to the next QBR. The conversation changes when the buyer has a number.
3. CFO-ready savings model. Use the embedded calculator to model your annual savings in 60 seconds — input your SKU count, current per-SKU rate, current turnaround, and get a CFO-ready PDF with payback period and 3-year NPV. The calculator is the bridge from "we think we're overpaying" to "here is the number for the budget conversation."
Run the CFO-ready savings report →
Free, email-gated PDF. Anchored to the same benchmark we just published.
The two cross-references worth opening next
If the benchmark surfaces a 50%+ overspend for your catalog, two follow-on reads will pay back the next 20 minutes of your day. The CFO's-eye-view post on the AI Product Photography ROI Calculator walks through the same calculator interface with the $1.2M contract decomposition our customers cite most often. The $19 Amazon 3D first-render piece shows how the same Brand DNA engine that anchors this benchmark scales down to a single-SKU validation purchase.
And the longer-form proof: the 18-month $5B US retailer case study documents how the benchmark numbers actually behaved across 4,200 SKUs in production — the per-SKU rate, the reshoot rate, the brand-consistency QA, and the all-in 60%+ cost reduction.
For enterprise pricing across pilots and scaled programs, the Advertflair AI Solutions pricing page shows the $2K, 10-SKU pilot through enterprise per-SKU rates that this benchmark anchors against.
Or talk to Hari directly →
15-minute walkthrough of the benchmark, the calculator, and what your category's median looks like.

Frequently asked questions
What does product photography cost per SKU in 2026? Traditional studio per-SKU rates range from $48 to $215 across the 5 benchmarked categories; AI-native production runs $19–$64. The blended median is $92 traditional vs. $31 AI-native — a 66% cost reduction at the median, widening at volume.
How does AI product photography cost compare to a traditional studio? 50–70% cheaper per SKU at the same brand-consistency bar. The bigger structural difference is reshoots: traditional studios average 1.8 reshoots per SKU at a per-revision charge; AI-native pipelines iterate inside the same Brand DNA model at zero per-revision cost. All-in gap is closer to 75%.
Where does the benchmark data come from? n=202 across three sources: 124 enterprise sales-call disclosures, 31 RFP samples, and 47 operator survey responses. The sample skews mid-market North America; Q3 2026 expands to n=400+ with an EU split.
How often is the benchmark refreshed? Quarterly. Q3 2026 adds three categories (outdoor, electronics, food and beverage). Q4 adds the EU geographic split.
Why is Advertflair publishing this? Transparent pricing is bad for vendors who charge enterprise rates for commodity work, and excellent for vendors whose unit economics actually justify the gap. We want every retail operator and CFO to see the same math we showed the $5B US retailer that ran our AI-native pipeline for 18 months.
Can I cite this benchmark in a press piece, RFP, or analyst report? Yes — CC BY 4.0. Attribution to "Advertflair Product Photography Cost Benchmark, 2026" is all that's required.
Hari Gurusamy
Founder & CEO, Advertflair (DBA Vela Studio, Glam AI, Style AI)
Hari founded Advertflair in 2016 and led the pivot from a 145-person 3D services firm to a 25-person enterprise AI product photography platform. The Brand DNA engine he and the team built has run in production at a $5B US retailer for 18 months, on the MBM Chairs 19-video animation program, on Crozier Fine Arts' Art Basel-tier visuals, on Veronique Gabai's luxury fragrance campaigns, and on Clutter's multi-market hero imagery. Connect with Hari on LinkedIn.

