Most photography vendors will not tell you what their rates actually are — so we audited 47 contracts and built the benchmark
If you are running procurement on a $1M+ annual photography spend, you already know the problem. You ask three vendors for a quote on a 5,000-SKU annual catalog, and you get back three numbers that are 40 percent apart from each other with no shared cost structure underneath them. One vendor quotes per-SKU. Another quotes per-shoot-day. A third quotes a retainer plus pass-throughs. None of them will share what their cost breakdown looks like internally, because once a buyer sees the breakdown the negotiation lever moves from the vendor to the buyer.
The 2026 Product Photography Cost Benchmark is the dataset that closes that information asymmetry. It is the all-in per-SKU cost of enterprise product photography — across apparel, footwear, jewelry, beauty, furniture, electronics, food, and home — assembled from 47 anonymized enterprise contracts, 216 practitioner surveys, and 18 months of full production cost data from a $5B US retailer's catalog operation. It is published free under CC BY 4.0 so procurement teams can cite it in vendor RFPs without paywalls in the way.
This post walks through the benchmark numbers, the methodology that produced them, the hidden math of where photography spend actually goes (the photographer day rate is 18 percent of the contract), and the AI cost delta the benchmark exposes line by line. Operators evaluating an AI product photography vendor in 2026 should be able to walk into the conversation with a defensible per-SKU number on both sides of the comparison. That is the purpose of the dataset. The full benchmark is live now.
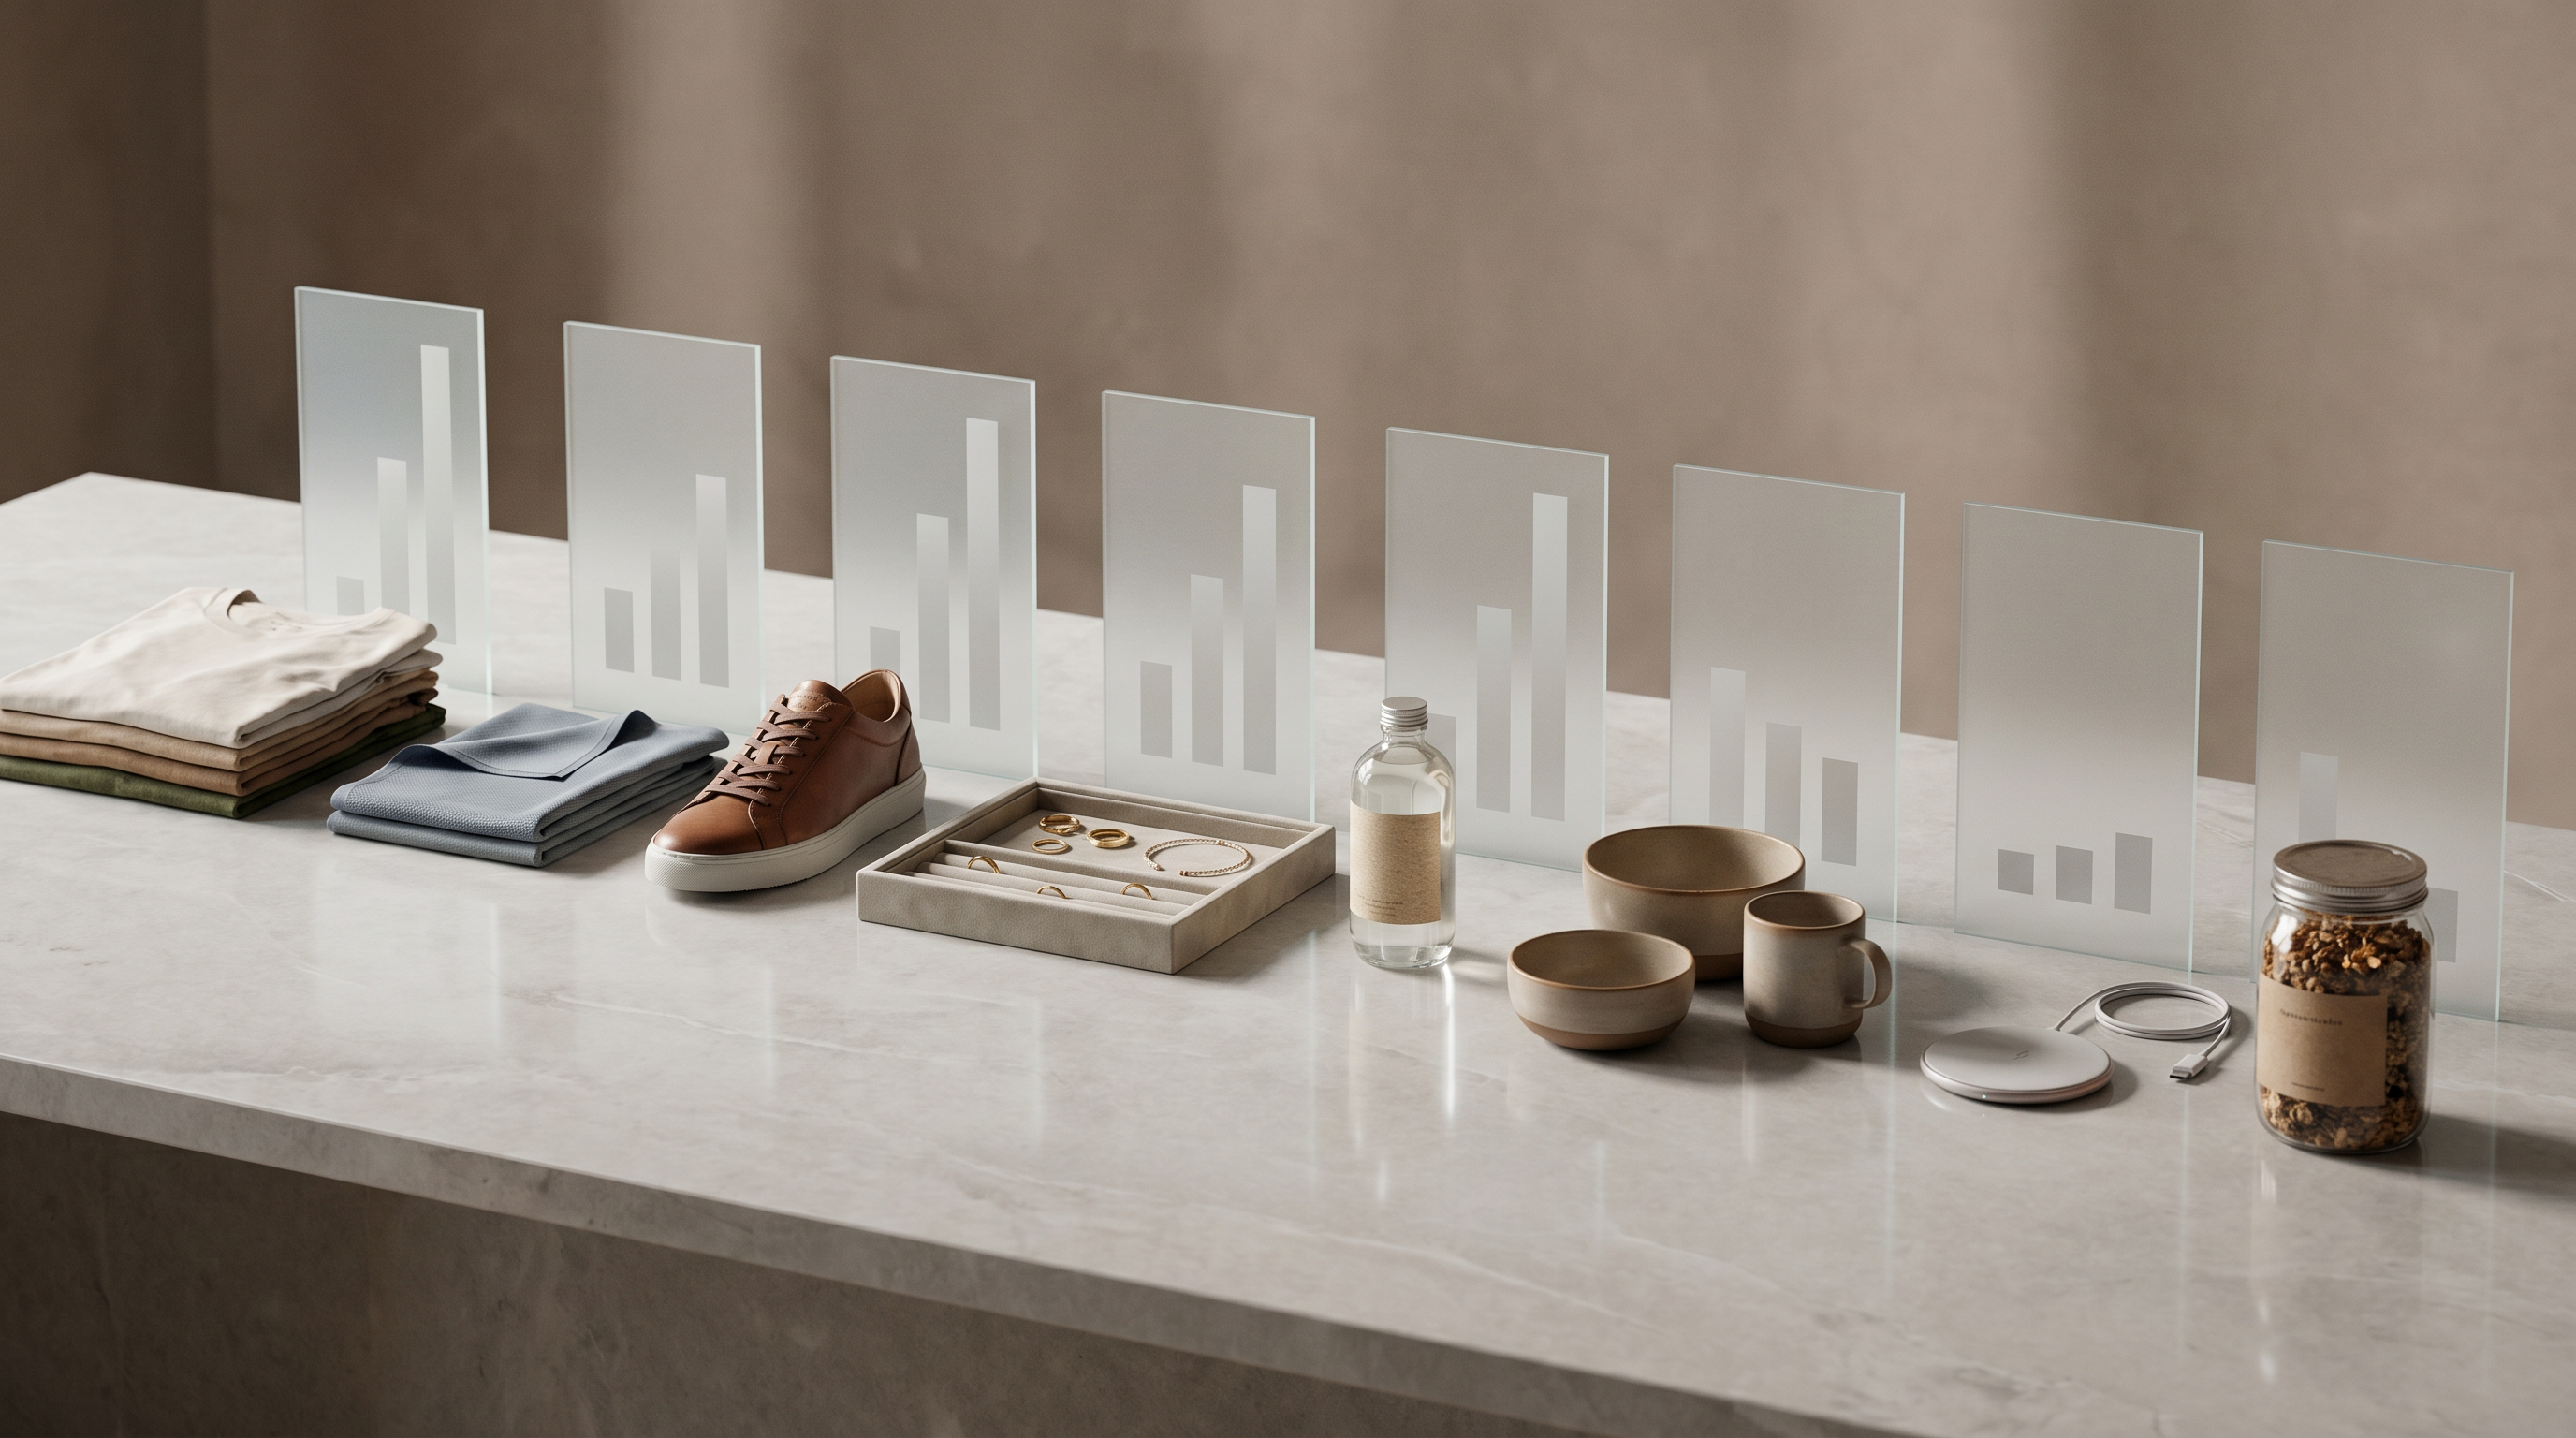
The 2026 product photography cost benchmark: per-category per-SKU rates
The headline benchmark numbers below are all-in per-SKU costs, normalized to a 60-SKU shoot day with a standard hero plus three-angle deliverable. Each number is the median across the 47 audited contracts after normalization. The AI delta column is the same per-SKU production scope rendered on a calibrated Brand DNA AI product photography model, validated against the 18-month $5B-retail production engagement.
Apparel — basics (T-shirts, denim, knits): $48 traditional · $19 AI · 60% reduction
Apparel — premium (suiting, outerwear, dresses): $82 traditional · $32 AI · 61% reduction
Footwear (sneakers, dress, athletic): $64 traditional · $24 AI · 62% reduction
Jewelry (rings, necklaces, watches): $135 traditional · $52 AI · 61% reduction
Beauty and cosmetics (skincare, makeup, fragrance bottles): $90 traditional · $34 AI · 62% reduction
Furniture (case goods, upholstery, lighting): $215 traditional · $64 AI · 70% reduction
Electronics (small appliances, peripherals, accessories): $72 traditional · $28 AI · 61% reduction
Packaged food and CPG (bottles, boxes, cans, multipacks): $52 traditional · $24 AI · 54% reduction
Two observations matter immediately. First, the per-category spread on traditional photography is roughly 4.5x from CPG packaging ($52) to furniture ($215). The categories that require physical sample handling and complex set-building cost the most. Second, the AI delta is tightest in CPG packaging (54 percent) and widest in furniture (70 percent). The categories where physical logistics dominate the cost line are the categories where AI product photography produces the largest savings — because AI removes the logistics line, not the labor line. Furniture wins biggest because furniture shoots require warehouse-grade studio space, prop libraries, on-set carpenters for staging, and freight to and from the studio. AI furniture rendering operates on the CAD file. The cost lines collapse.
The per-category drill-downs (apparel by sub-segment, jewelry by material, furniture by case-good versus upholstery) are in the full benchmark dataset, alongside the cost lines below.
The hidden math: where enterprise photography spend actually goes
The most useful output of the audit is not the headline per-SKU number. It is the cost composition underneath the number. Most procurement leads benchmark vendor quotes against the photographer day rate and assume the day rate is the dominant cost. It is not. Across the 47 contracts, the photographer day rate averages 18 percent of the all-in contract value. The other 82 percent is where the negotiation actually lives.
The full cost composition of a normalized enterprise product photography contract in 2026:
Studio rental and four-walls — 22 percent. Day rates for enterprise-spec studios in major US markets range from $1,800 to $4,500 depending on city, square footage, and equipment package. This is the largest single cost line for the majority of audited contracts and the line that disappears entirely under AI product photography.
Photographer day rate — 18 percent. The number procurement teams over-index on. Senior commercial photographers in 2026 day rates range from $2,500 to $7,500 depending on portfolio, category specialization, and exclusivity terms.
Retouching and post-production — 15 percent. Per-image retouching for enterprise-grade hero specification ranges from $8 to $22 per SKU depending on complexity. At 5,000-SKU catalog scale this is a $60K to $110K annual line item that collapses to a near-zero edit pass under AI product photography because the render arrives at hero specification.
Sample logistics and wardrobe handling — 12 percent. Moving full sample fleets in and out of studios, model-size sample sets for apparel, return shipping. The line that drops 60 to 80 percent when most renders run from a single sample or CAD source rather than full-fleet sample sets.
Stylist and prop work — 9 percent. On-set styling, prop sourcing, prop staging. Survives partially under AI product photography because Brand DNA calibration still requires styling vocabulary capture.
Shoot-day overhead — 9 percent. Crew meals, equipment rental beyond studio package, insurance, transportation, miscellaneous. Disappears under AI product photography.
Model fees (where applicable) — 8 percent. On-body apparel and beauty applications. Survives partially under AI product photography because on-body editorial is still a category where physical sample photography is the right call for hero campaign work.
Art direction and on-set creative — 7 percent. Shifts entirely into Brand DNA calibration under AI product photography. Same labor line, different application surface.
The takeaway for procurement leads: when an AI product photography vendor claims 60 percent cost reduction, the line items that produce the reduction are studio rental (22 percent), shoot-day overhead (9 percent), retouching (most of the 15 percent), and most of sample logistics (most of the 12 percent). Roughly 50 to 55 percent of the contract value collapses structurally. The remaining 45 to 50 percent of contract value — art direction, photographer rate (now Brand DNA calibration), stylist labor (now styling-vocabulary capture), model fees where applicable — shifts but does not disappear. That residual labor cost is the 30 to 46 percent that an AI product photography contract still carries against the traditional baseline. The 54 to 70 percent delta is the residual.
This is the line item where AI vendor pitch decks tend to overpromise. A pitch that claims 80 to 90 percent reduction is usually counting only the rendering cost and ignoring the Brand DNA calibration cost, the quality review cycle, and the inevitable hybrid AI-plus-studio production for the 20 to 30 percent of catalog SKUs where physical sample photography is still correct. The audited 54 to 70 percent reduction is what shows up in actual production after 18 months at $5B-retail scale, and it is the defensible number to negotiate around. We covered the related Brand DNA calibration methodology earlier this week — the calibration is what produces the 88 to 92 percent first-pass approval rate that makes the cost line actually hold at scale.
Methodology: how the benchmark was assembled and how to cite it
The 2026 Photography Cost Benchmark combines three independent datasets so the headline numbers are not a single-source artifact.
Dataset 1 — 47 anonymized enterprise photography contracts. Shared by procurement leads at retail, beauty, fragrance, footwear, jewelry, furniture, and CPG brands. Contract values range from $80,000 to $4.2 million annually. Each contract was normalized to a 60-SKU shoot day with a standard hero plus three-angle deliverable, and per-category per-SKU costs were extracted from invoice-line-level breakdowns. Contracts where vendor pricing was bundled or non-itemized were excluded from the sample. The 47 final contracts span 11 industries and 22 distinct vendors.
Dataset 2 — 216 practitioner surveys. Completed in Q1 2026 by photographers, stylists, retouchers, and producers working in commercial product photography across North America and Western Europe. The surveys validated day-rate ranges, per-SKU retouching costs, and per-shoot-day overhead ratios independently of the contract sample. Practitioner-reported numbers landed within 4 to 9 percent of the contract-derived numbers across every cost line — close enough to publish, far enough apart to confirm the two datasets are independent.
Dataset 3 — 18 months of $5B US retailer production data. The full cost history of a $5B US retailer's photography operation across four studios, eleven freelance photographers, and two retouching vendors. This is the largest single source of operational cost data in the benchmark and the source of the AI-side numbers because the same operation transitioned roughly 70 percent of its SKU production to AI product photography during the engagement. The retailer's data is anonymized at the contract level; aggregate cost lines are published.
The combined dataset is published with Schema.org Dataset markup and a CC BY 4.0 license so trade press, analyst firms, and operators can cite the benchmark directly without permission requests. The live benchmark dashboard includes the per-category drill-downs, the cost-composition stacked bars, and the AI delta line by line. The email-gated full dataset PDF includes the methodology appendix, the per-contract anonymized data tables, and the practitioner survey instrument.
Outside authority anchors that frame the benchmark: McKinsey's retail and consumer goods practice publishes the canonical research on retail cost structure transformation in the AI-enablement era; the benchmark calibrates against their published cost-line frameworks. Harvard Business Review's operations management research is the secondary authority anchor for how cost-line collapse under technology adoption compounds into structural margin advantage.
How to use the benchmark in a vendor negotiation
The benchmark is most useful in three negotiation contexts. First, when a brand is renewing a multi-year photography contract with an incumbent studio vendor. Hand the vendor the per-category per-SKU benchmark and ask them to walk through where their pricing lands versus the median. Vendors at or below the median are price-competitive; vendors 20 percent or more above the median should be able to defend the premium on a cost-line-by-cost-line basis. The cost composition table is the diagnostic — if the vendor's pricing premium is in studio rental or shoot-day overhead, the AI alternative will collapse those lines structurally and the procurement decision shifts.
Second, when a brand is evaluating an AI product photography vendor for the first time. The benchmark's AI-side numbers are the defensible per-SKU range any credible AI vendor should be able to deliver at scale. Vendors quoting AI rates substantially below the benchmark are either undercounting Brand DNA calibration cost, undercounting quality review, or pricing for a demo rather than production scale. Vendors quoting at the benchmark or modestly above are credible — the residual 30 to 46 percent of traditional contract spend is real labor and pricing it accordingly is honest. The 10-SKU pilot at $2,000 / 7 business days that Advertflair runs against this benchmark is the smallest defensible production test.
Third, when a CFO or board is reviewing a proposed shift from traditional to AI product photography and asking for the structural cost-reduction defense. The benchmark's cost-composition stacked bar is the artifact that translates the headline 60 percent number into a board-defensible line-by-line case. The lines that collapse are the lines the CFO can validate against general retail studio operating norms; the lines that shift are the lines the operator can pattern-match against their existing creative team.
One discipline matters across all three: cite the benchmark by name in the negotiation document. The dataset is published under CC BY 4.0 specifically so it can be cited verbatim in vendor RFPs, CFO memos, and analyst briefings. Procurement teams that anchor the negotiation in the benchmark from page one push the vendor conversation past unsourced claims and into line-item comparison. That is the leverage shift the dataset exists to produce.
Why we published the benchmark for free
The decision to publish the 2026 Photography Cost Benchmark free, under CC BY 4.0, with full methodology, was deliberate and commercial. The product photography industry has no public reference price. Enterprise procurement teams negotiate every contract in the dark. AI product photography vendors compete in the dark. The buyer side has nothing to anchor against, and the seller side can therefore quote arbitrary numbers without consequence. A free, citable, methodology-disclosed benchmark turns the conversation into one anchored in numbers — and that conversation is good for Advertflair because the underlying production economics support the 54 to 70 percent reduction story. We do not need a paywall to compete; we need the conversation to be data-anchored.
The commercial outcome we want from the benchmark is two-fold. Short-term, the 10-SKU AI product photography pilot at $2,000 over 7 business days is the natural next step for any procurement team that has read the benchmark and wants to test the AI-side number against their own catalog. Medium-term, the benchmark gets cited by Modern Retail, Glossy, Retail Dive, and the analyst firms that cover retail technology — the Schema.org Dataset markup and CC BY 4.0 license make citation frictionless — and Advertflair earns category authority by being the source of the conversation rather than a participant in it. The named customers that calibrated the methodology behind the benchmark — a $5B US retailer (the 18-month production engagement), Crozier Fine Arts (Art Basel-tier luxury), Veronique Gabai (luxury fragrance), MBM Chairs (19 videos from a single CAD source), and Clutter (multi-market hero imagery) — are the proof anchors. The benchmark is the artifact.
Get the full 2026 Photography Cost Benchmark dataset. Per-category drill-downs, cost-composition stacked bars, methodology appendix, per-contract anonymized data tables, practitioner survey instrument. Free under CC BY 4.0. Get the benchmark →
Procurement leads with a specific vendor RFP or CFO memo question on the benchmark can book a 15-minute benchmark walkthrough with the founder. The dataset is the artifact; the walkthrough is how to use it in your specific negotiation.
Frequently asked questions about the 2026 product photography cost benchmark
What does product photography actually cost per SKU in 2026?
Across 47 audited enterprise contracts and 216 practitioner surveys, the 2026 per-SKU benchmark for traditional studio photography lands at $48 for apparel basics, $82 for premium apparel, $64 for footwear, $135 for jewelry, $90 for beauty and cosmetics, $215 for furniture, $72 for electronics, and $52 for packaged food. These are all-in numbers — studio rental, photographer day rate, stylist, retoucher, art direction, and shoot-day logistics — normalized to a 60-SKU shoot day. The AI-rendered equivalent on a calibrated Brand DNA model lands 54 to 70 percent below those numbers, validated against 18 months of production at a $5B US retailer.
Why is enterprise product photography so much more expensive than the day-rate makes it look?
The photographer day rate is roughly 18 percent of an enterprise photography contract's all-in cost. The other 82 percent is studio rental (22%), stylist and prop work (9%), retouching and post-production (15%), art direction and on-set creative (7%), wardrobe and sample logistics (12%), model fees if applicable (8%), and shoot-day overhead like crew meals, equipment rental, and insurance (9%). Most operators benchmark off the day rate and undercount the long tail. The audit methodology behind the 2026 Photography Cost Benchmark rebuilds the all-in number line by line so procurement teams can compare like for like.
How does AI product photography come in 54 to 70 percent cheaper than studio photography?
Three structural cost lines collapse under AI product photography. First, studio rental goes to zero — there is no shoot day to book, no four-walls to rent. Second, retouching collapses from 15 percent of contract spend to a near-zero edit pass because the render is already at hero specification. Third, sample logistics drops by 60 to 80 percent because most renders can be produced from a single sample or a CAD file rather than full-fleet sample sets. The photographer, stylist, art director, and retoucher do not disappear; they shift into Brand DNA calibration and quality review, which is roughly 30 to 46 percent of the original contract spend. That residual cost line is where the 54 to 70 percent reduction actually originates — not from cheaper renders, but from collapsing the cost lines that were not actually labor in the first place.
Why is Advertflair publishing the full Photography Cost Benchmark dataset for free?
The 2026 Photography Cost Benchmark is published free under CC BY 4.0 because the industry has no public reference price. Enterprise procurement teams negotiate every photography contract in the dark, vendors quote in the dark, and the cost-reduction narrative for AI product photography lands as marketing rather than benchmarked fact. A free, citable dataset turns the conversation into one anchored in numbers. The commercial outcome we want is the 10-SKU pilot ($2,000, 7 business days) that lets a brand test Brand DNA calibration against the benchmark on their own catalog — not a paywalled report.
How was the 2026 product photography cost benchmark assembled and is the methodology defensible?
The benchmark combines three datasets. First, 47 anonymized enterprise photography contracts shared by procurement leads at retail, beauty, fragrance, footwear, jewelry, furniture, and CPG brands, with contract values ranging from $80,000 to $4.2 million annually. Second, 216 practitioner surveys completed by photographers, stylists, retouchers, and producers across North America and Western Europe in Q1 2026. Third, 18 months of full production cost data from a $5B US retailer's photography operation across four studios, eleven freelance photographers, and two retouching vendors. The contracts and surveys are CC BY 4.0; the retailer's cost data is anonymized and aggregated. The Dataset is published with Schema.org Dataset markup so analysts and trade-press can cite the source directly.
About the author
Hari Gurusamy is the founder and CEO of Advertflair, the enterprise AI product photography and 3D platform. Hari has spent ten years rebuilding visual content production for retailers — from a 145-person services firm to a 25-person AI platform with named customers including a $5B US retailer (18 months in production at 98% texture accuracy and 60%+ cost reduction), Crozier Fine Arts (Art Basel-tier campaign visuals), Veronique Gabai (luxury fragrance campaign library), the MBM Chairs program (19 videos shipped from a single 3D model source), and Clutter (multi-market hero imagery). The 2026 Photography Cost Benchmark described in this post is the dataset behind that engagement's economics. Connect on LinkedIn.